9.1quiz_dash - Monitor in real time and correct with quiz_dash - 🧑🏫🏫
As described above, you can load the results table at the terminal level and perform all the tests and statistics you want. However, it is easier to use a small graphical utility to do this. This monitoring and analysis dashboard is available here:
https://
🛠 In addition to cloud deployment, the application can also be installed locally using from pypi by
pip install quiz-dash 🛠 or from git
pip install git+https://github.com/jfbercher/labquiz.git#subdirectory=quiz_dashAn entry point is provided, allowing it to be used directly from the command line by simply invoking quiz_dash.
Based on the Google Sheet URL specification, the associated read password, and the YAML file containing the answers, this dashboard allows you to:
track over time, with an adjustable refresh rate, the submissions made by each participant, with the labels of the relevant quizzes,
check integrity, i.e., verify that the parameters (number of attempts allowed, mode, etc.) have not been modified, verify the hash of the sources, the object in memory, and its dependencies,
view, over time, the progress of each participant (filterable) and of the entire group,
correct and retrieve the results table,
download pdf reports of full corrections for all participants,
with the possibility of adjusting the weight matrix (for multiple-choice questions) and the scoring scale per question;
analyse participation, with the quantification of early or late attempts as well as retakes after the main session.
Some screenshots of actual monitoring:
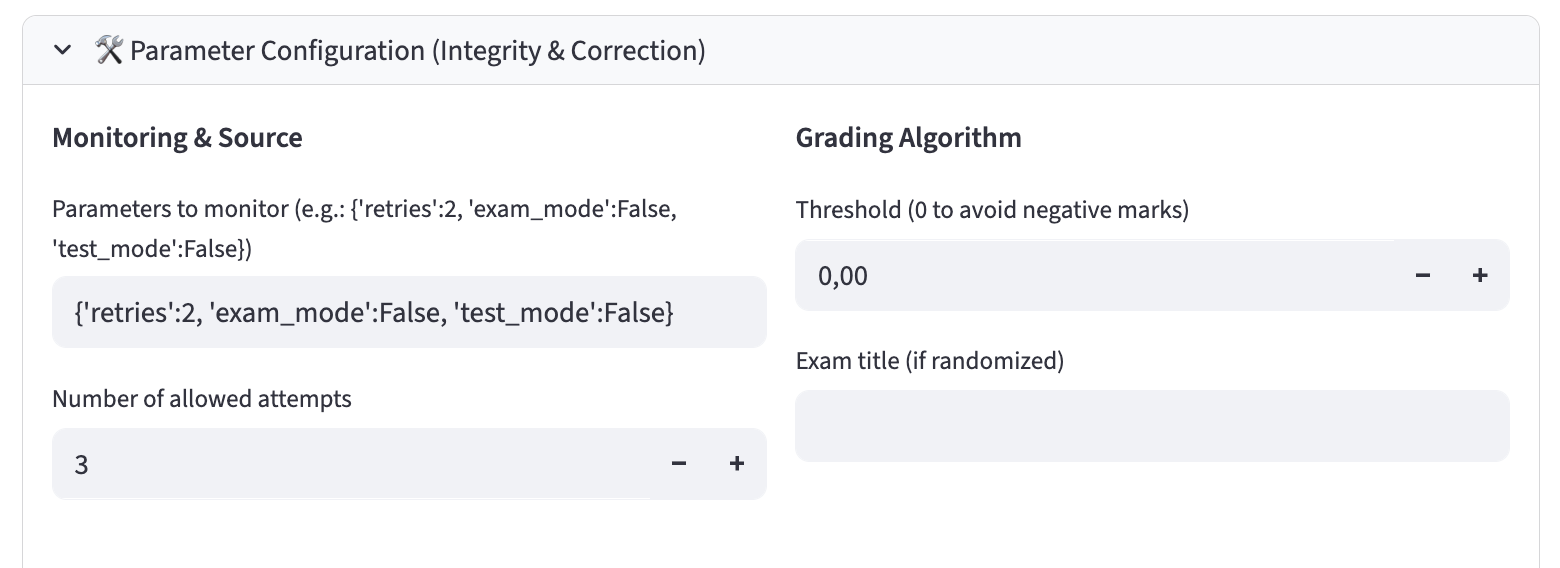
Figure 27:quiz_dash -- Entering monitoring/correction configuration parameters
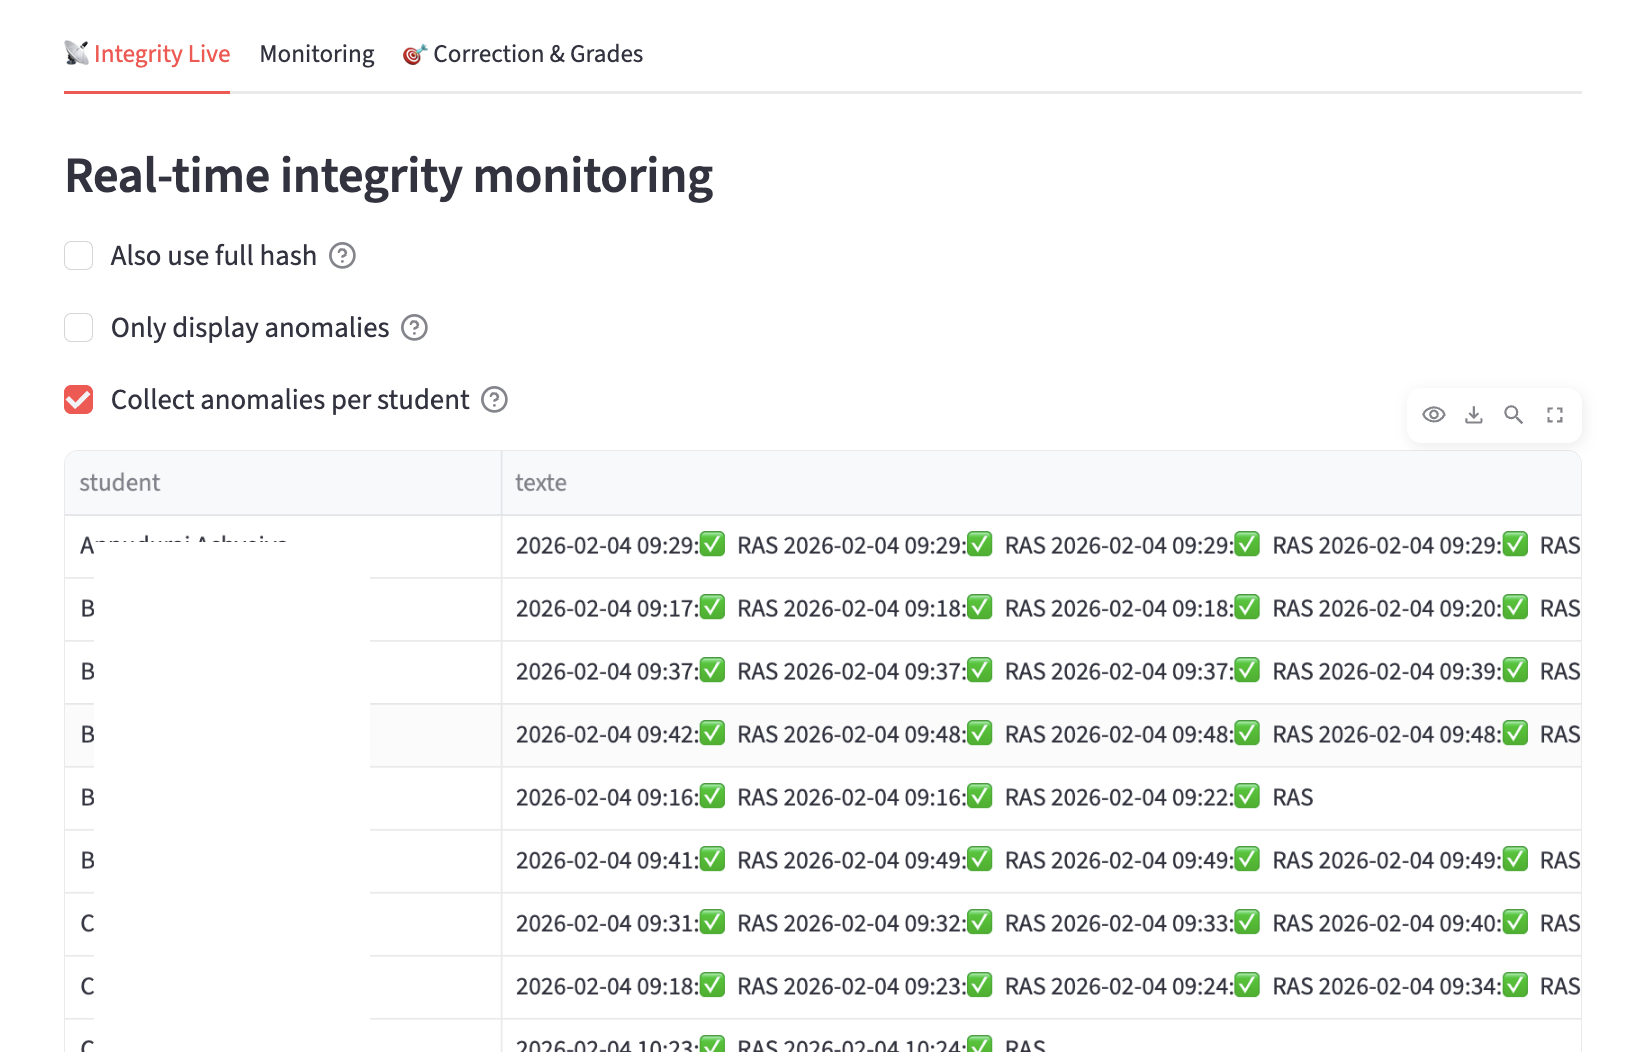
Figure 28:quiz_dash -- Integrity monitoring
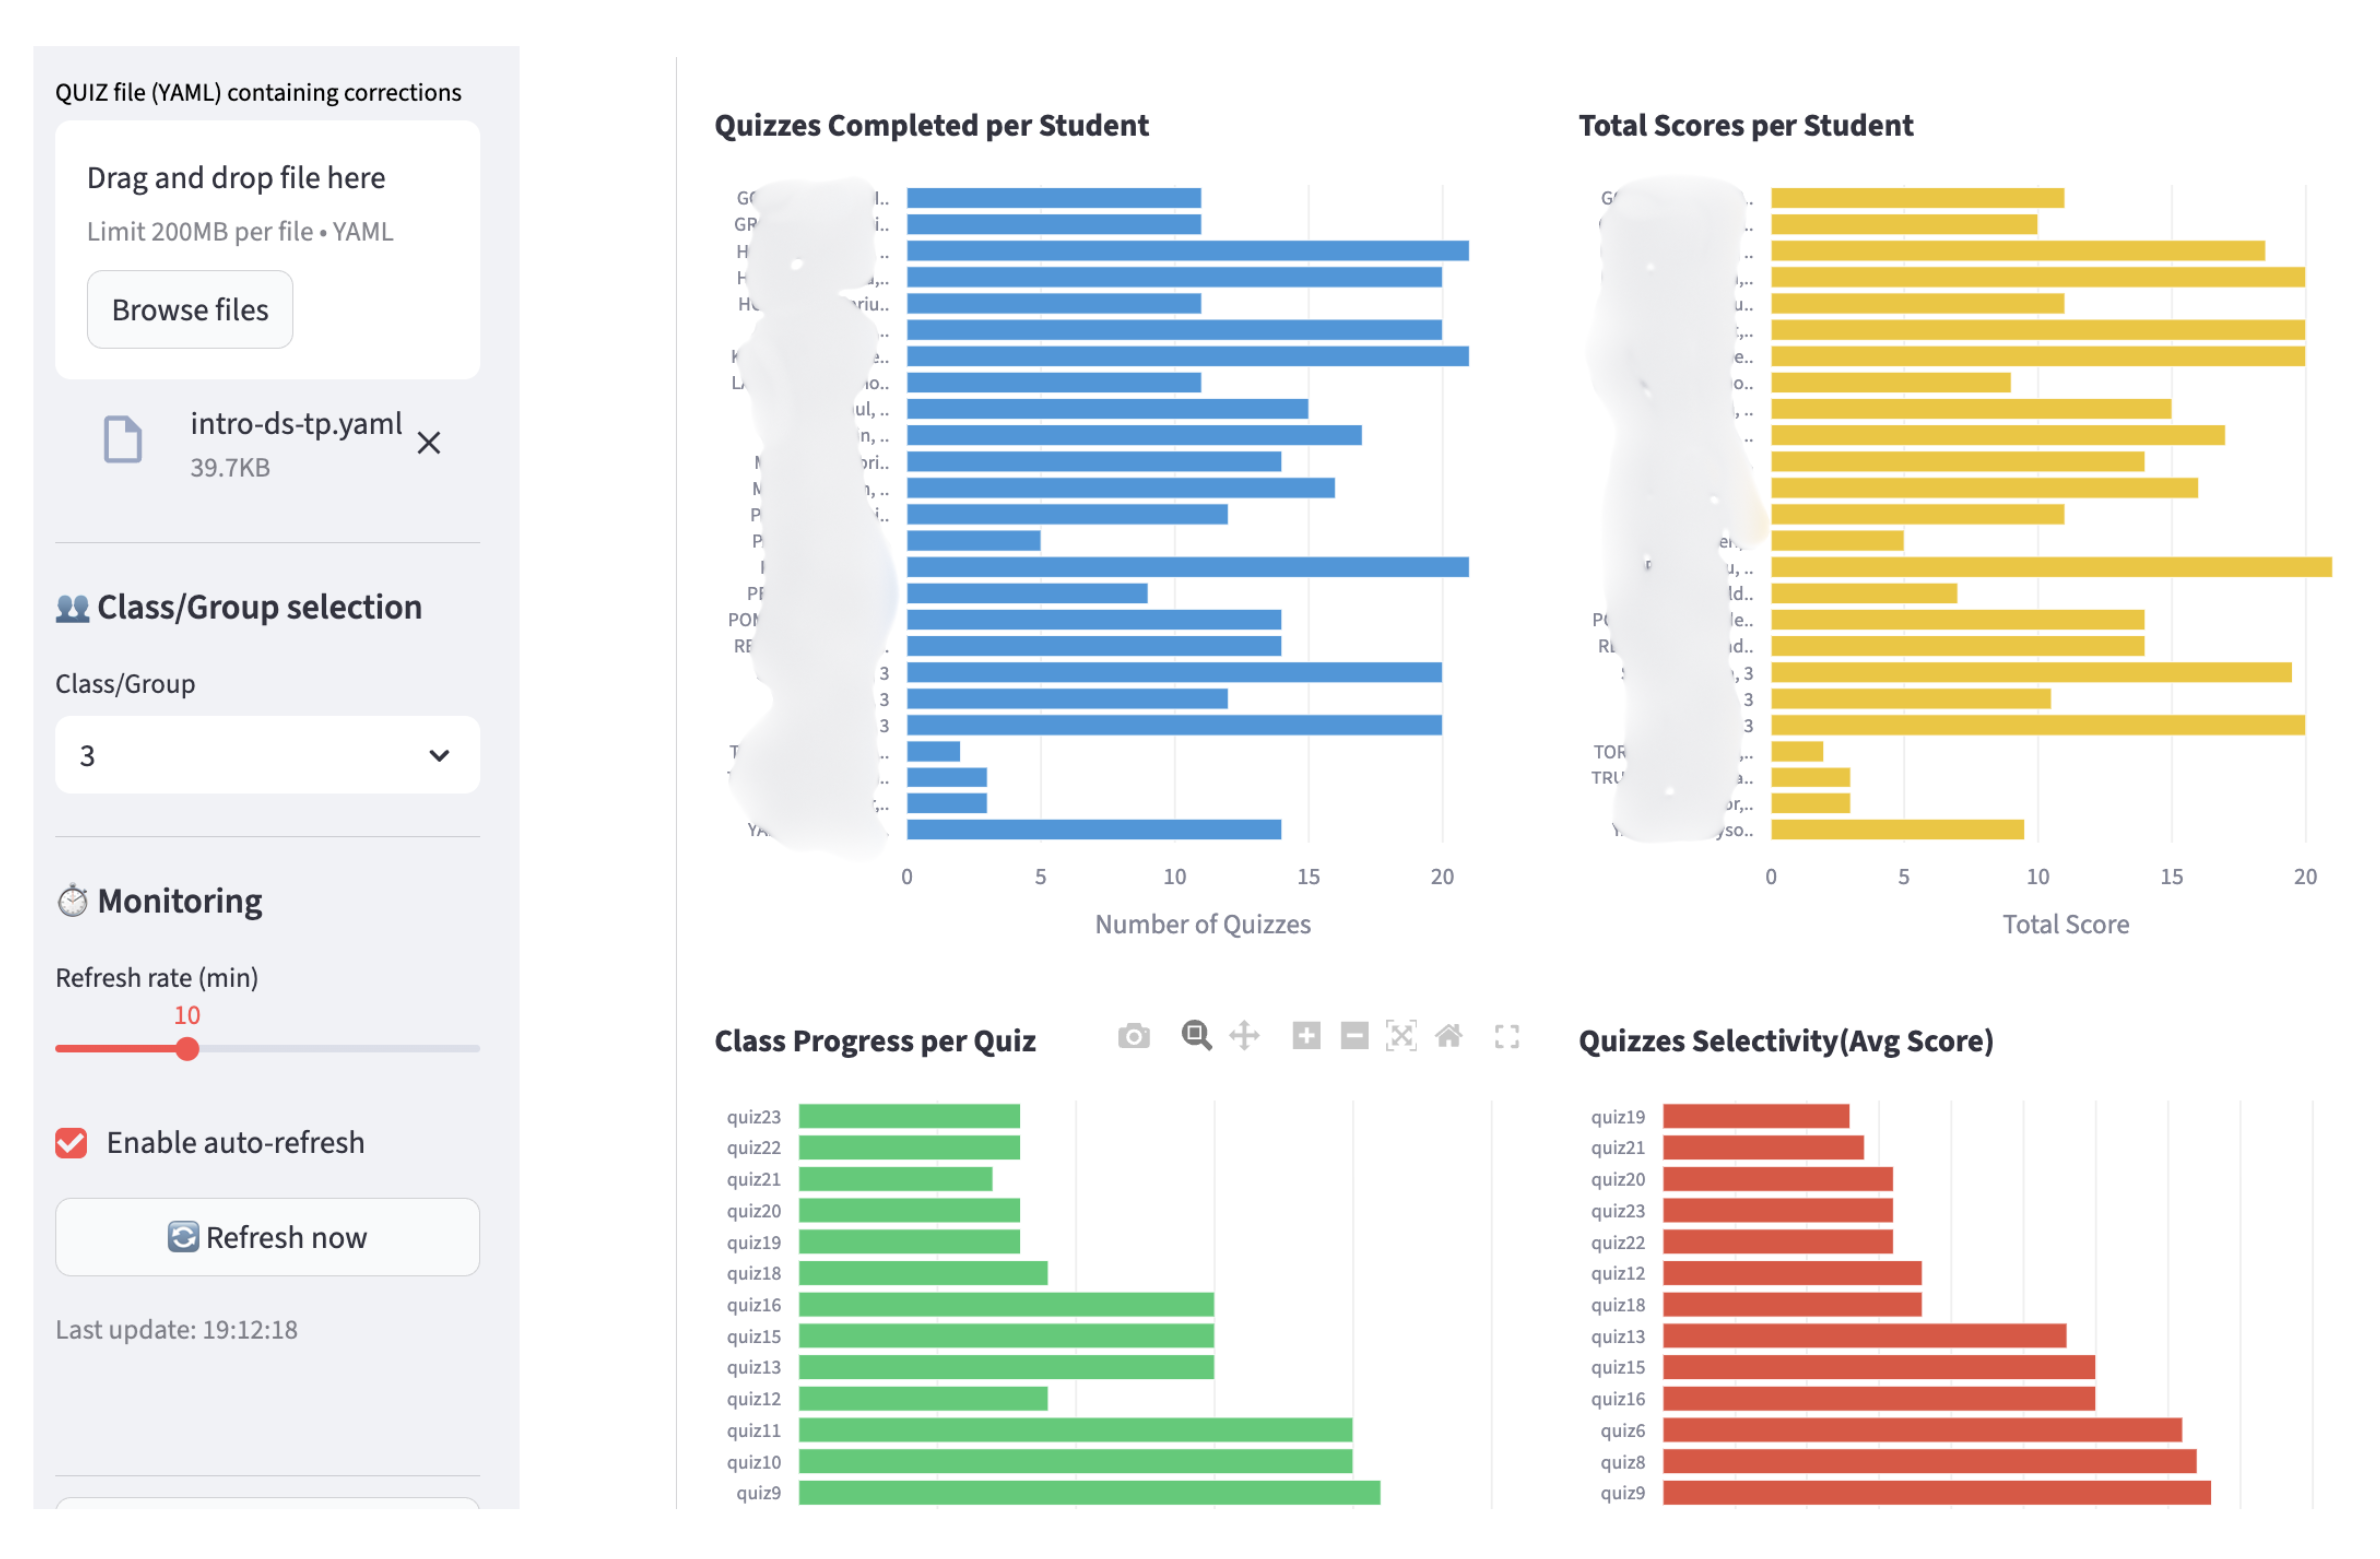
Figure 29:quiz_dash -- Monitoring of quizzes taken by students and the group. Automatic refresh possible and adjustable (student names have been hidden)
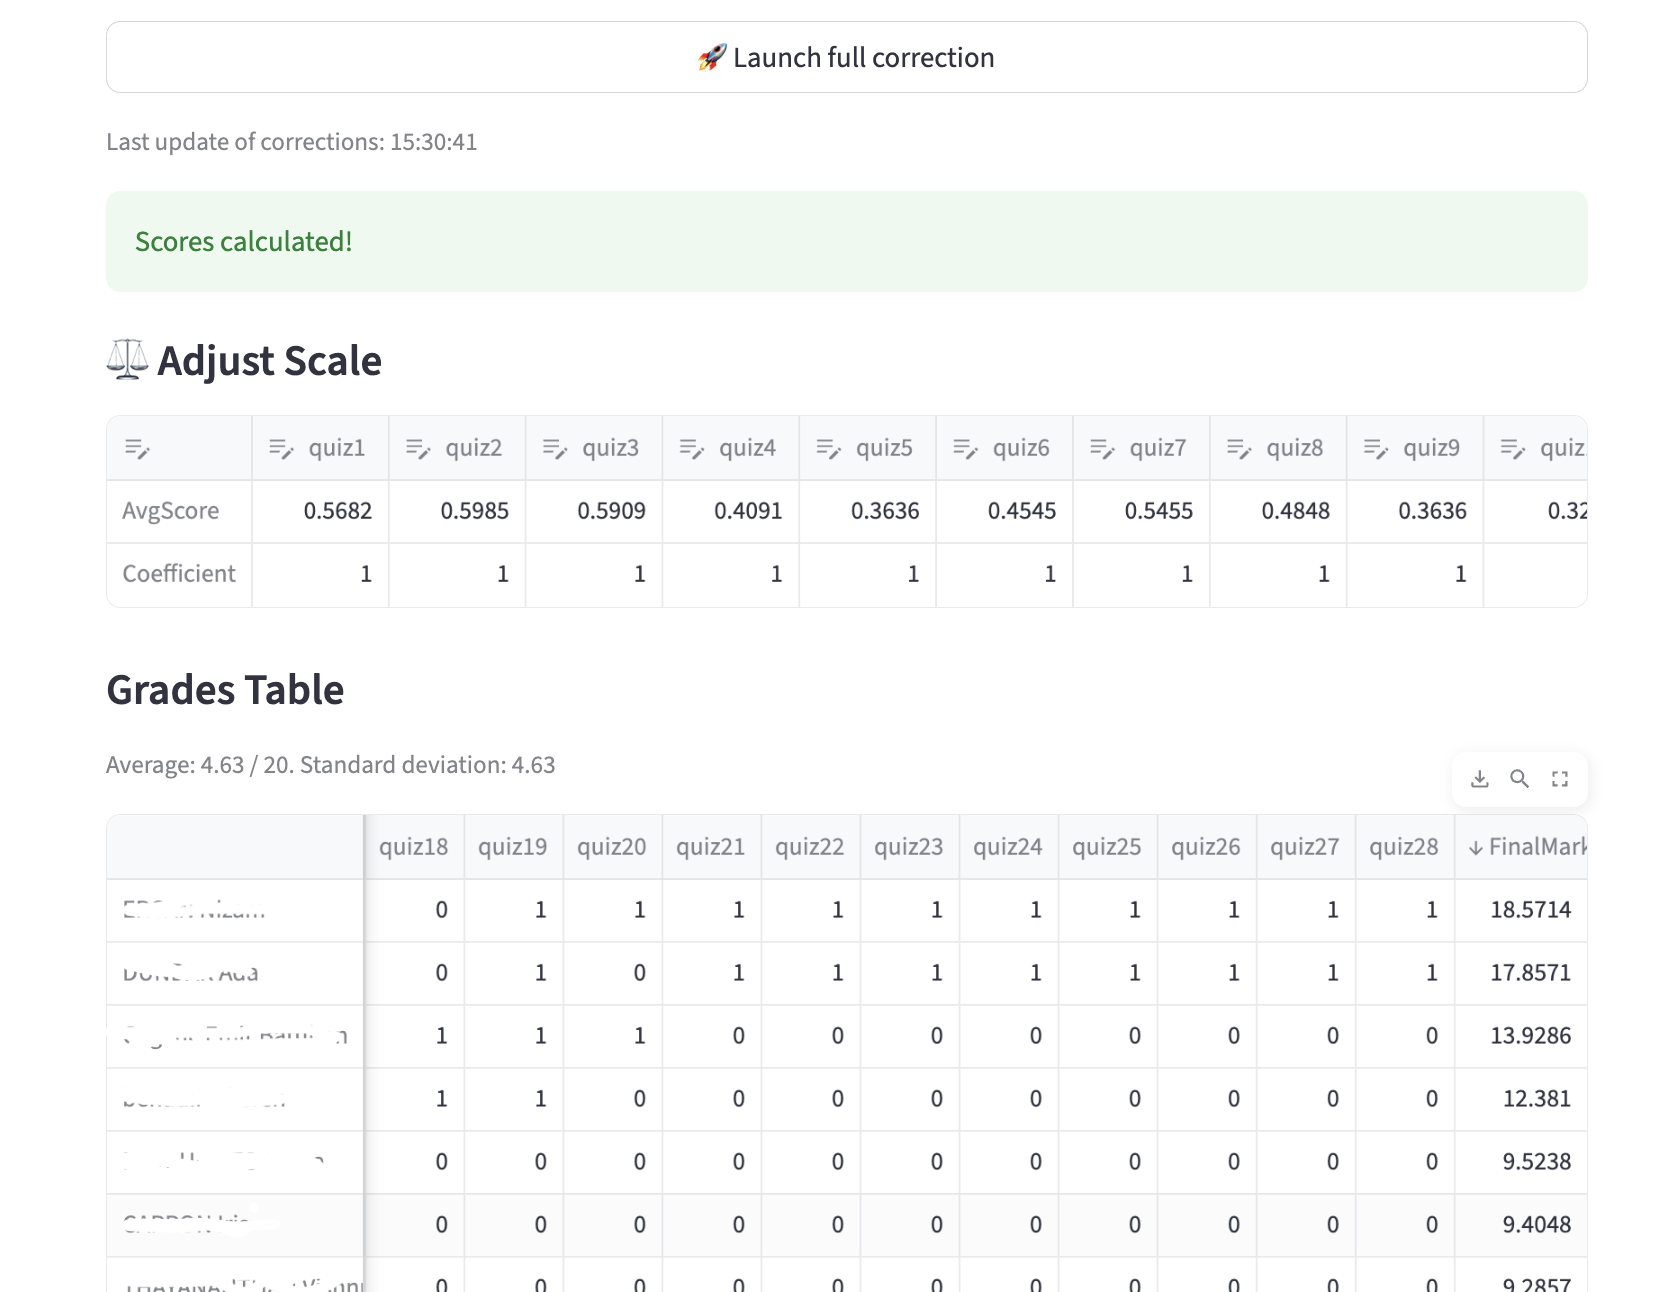
Figure 30:quiz_dash -- Automated correction, with the option to adjust the scoring system (automatic recalculation); (student names have been hidden). Of course, the results table can be downloaded.
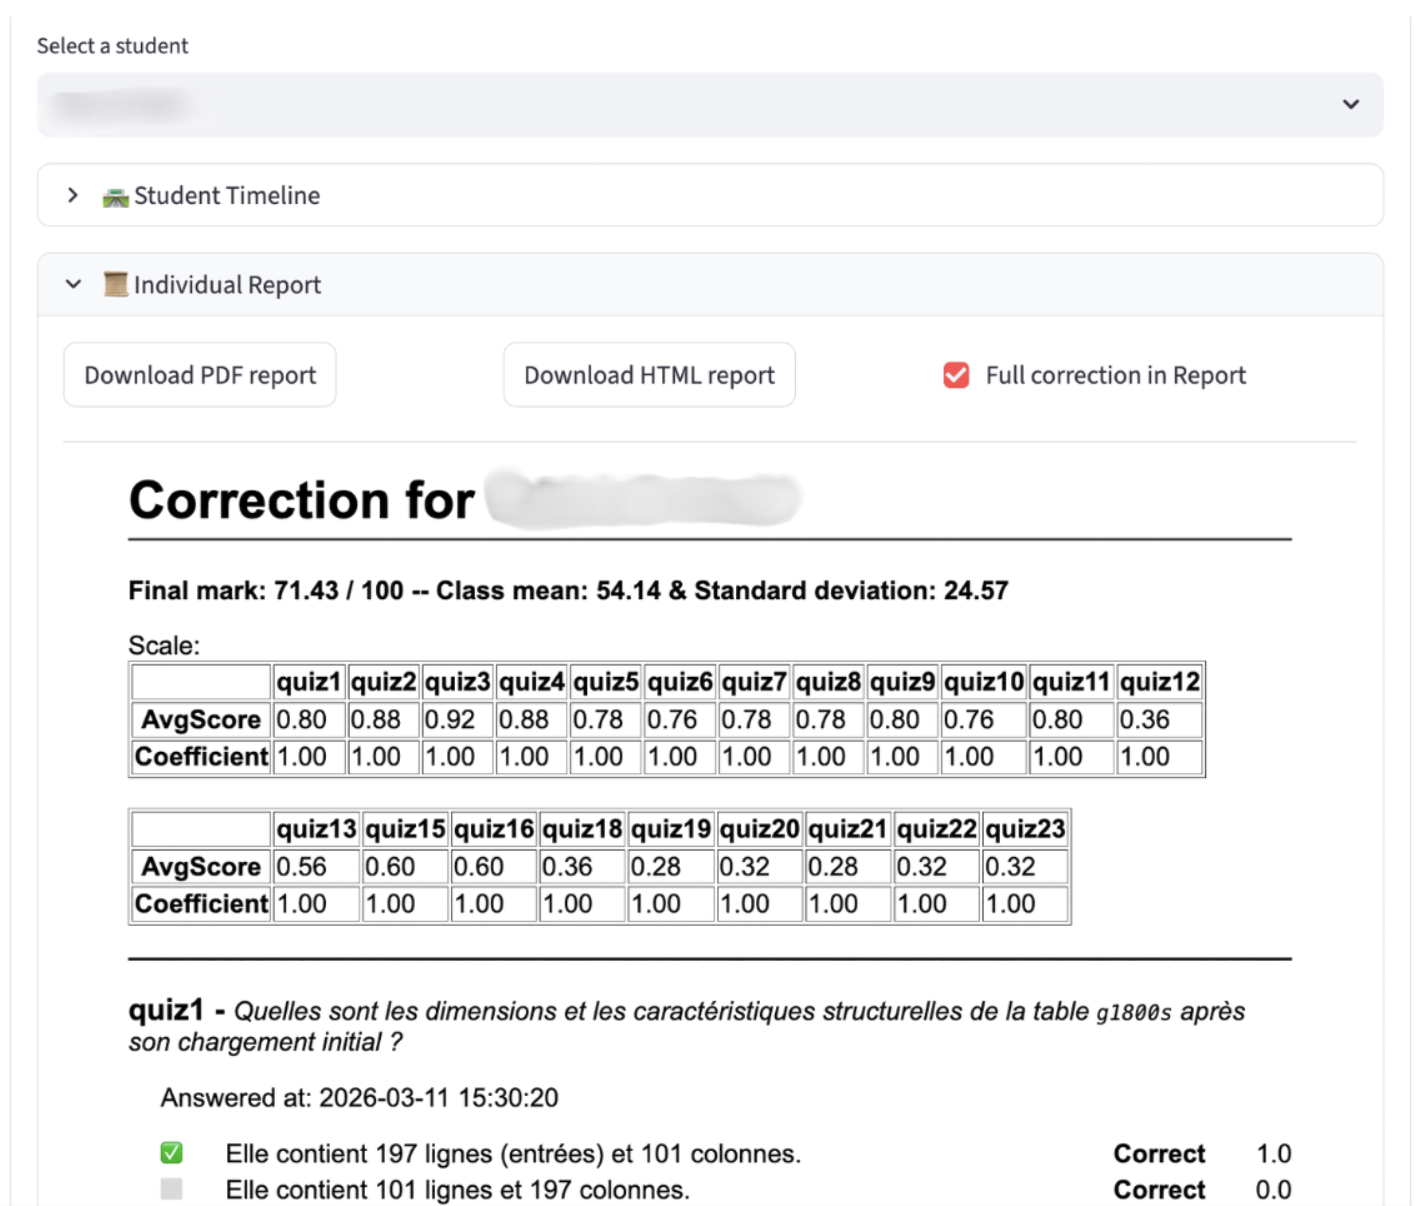
Figure 31:quiz_dash -- Individual correction can be generated for a student.
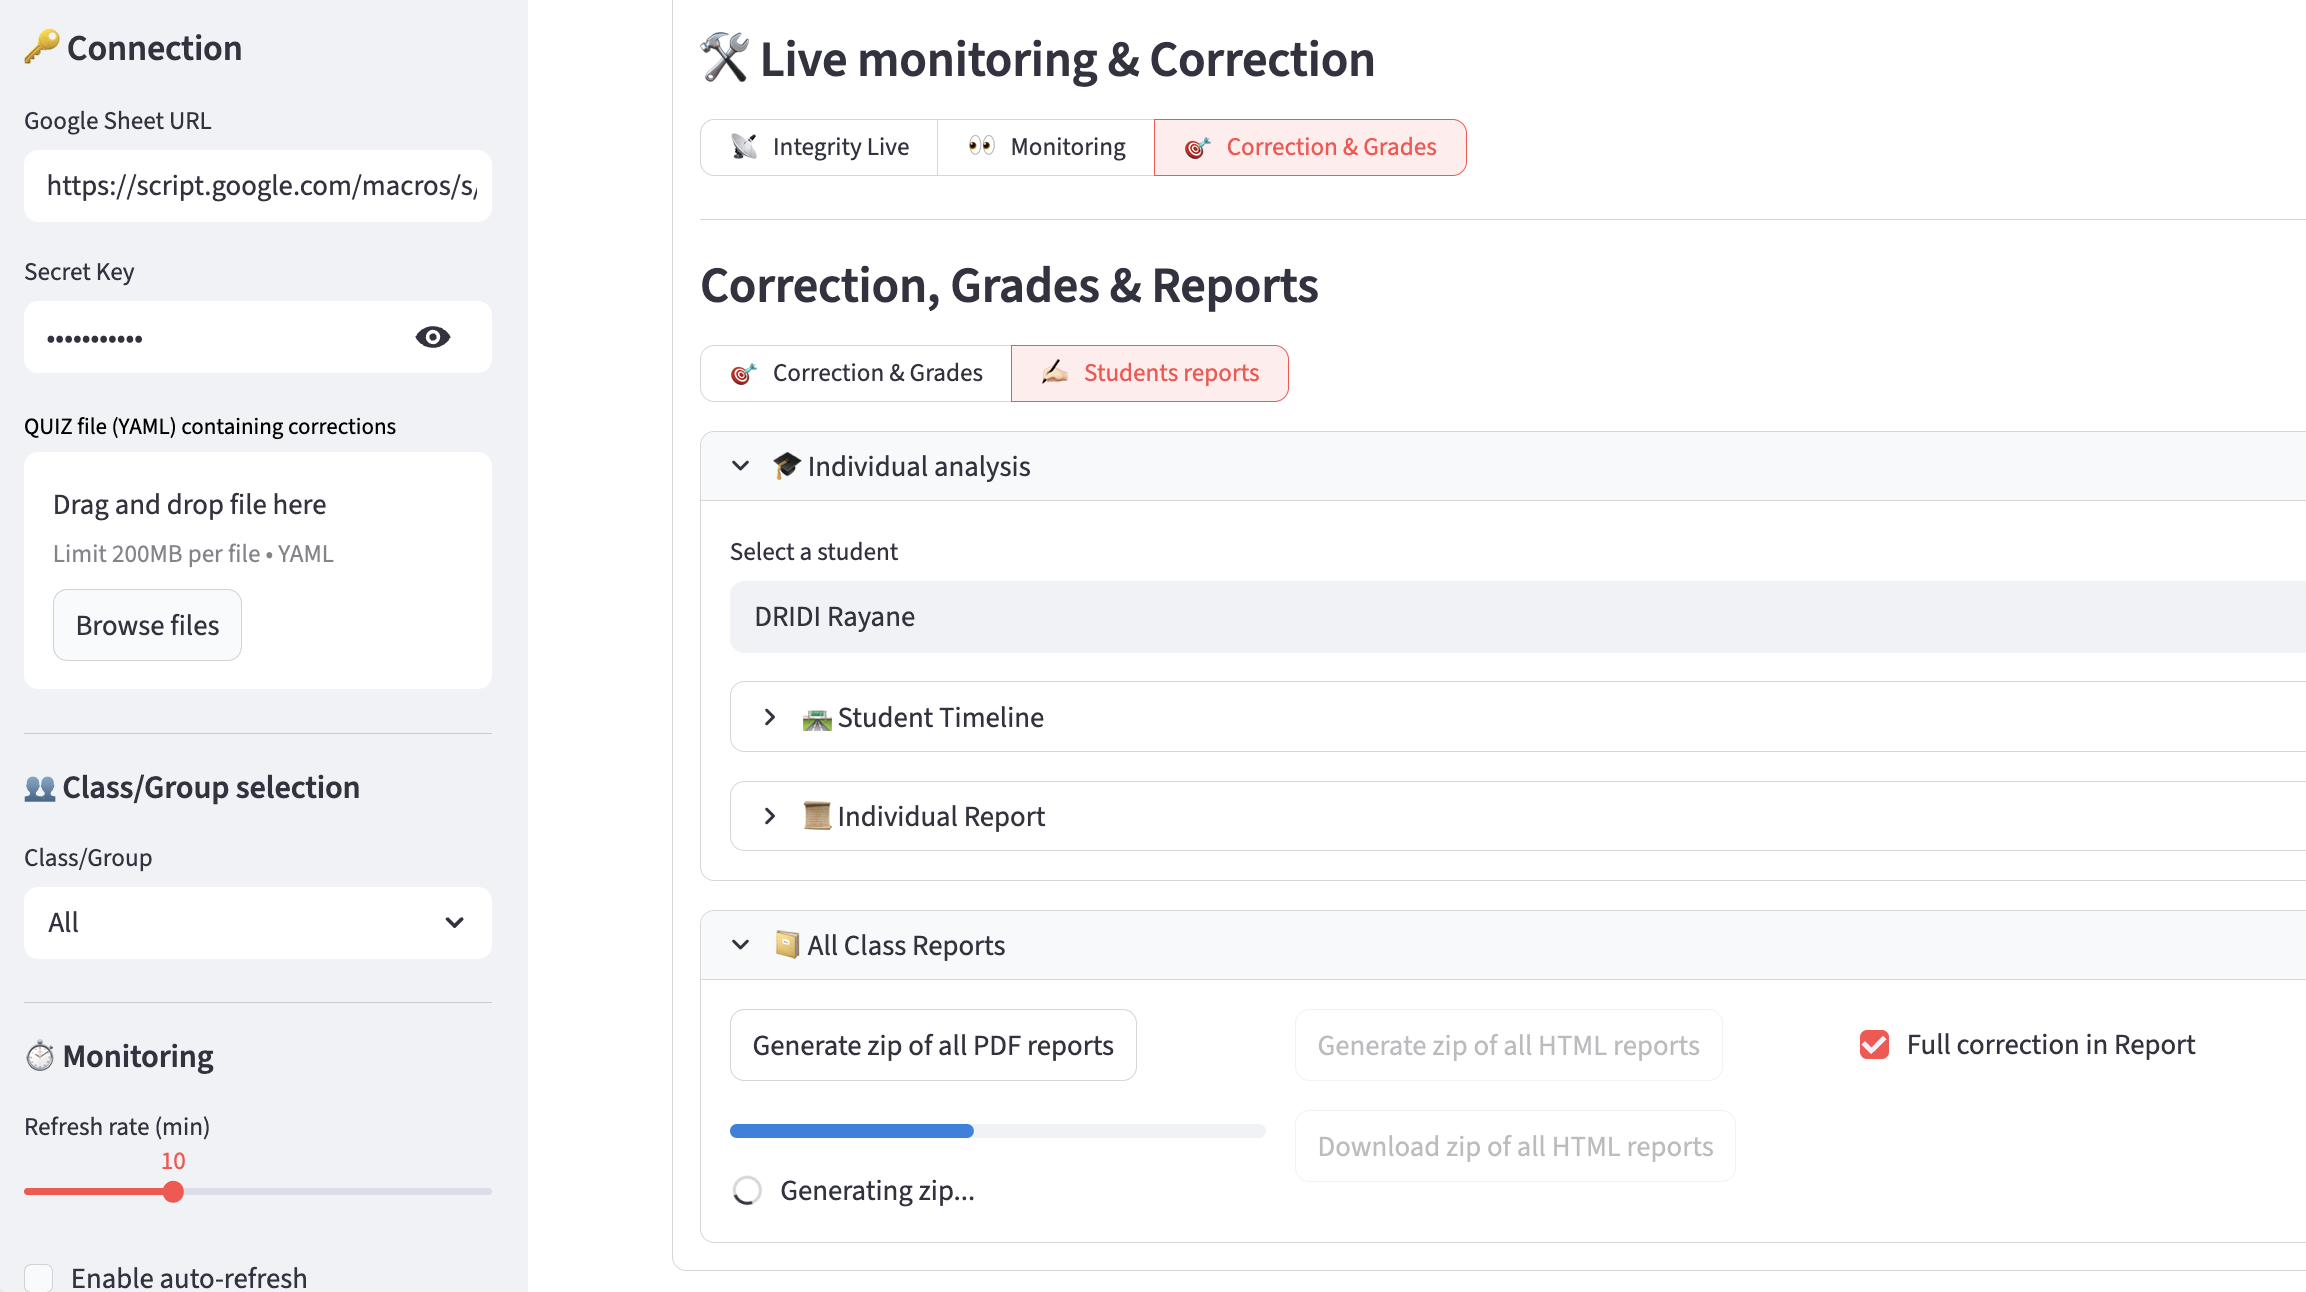
Figure 32:quiz_dash -- Individual reports can be downloaded so that you can distribute them to the students.
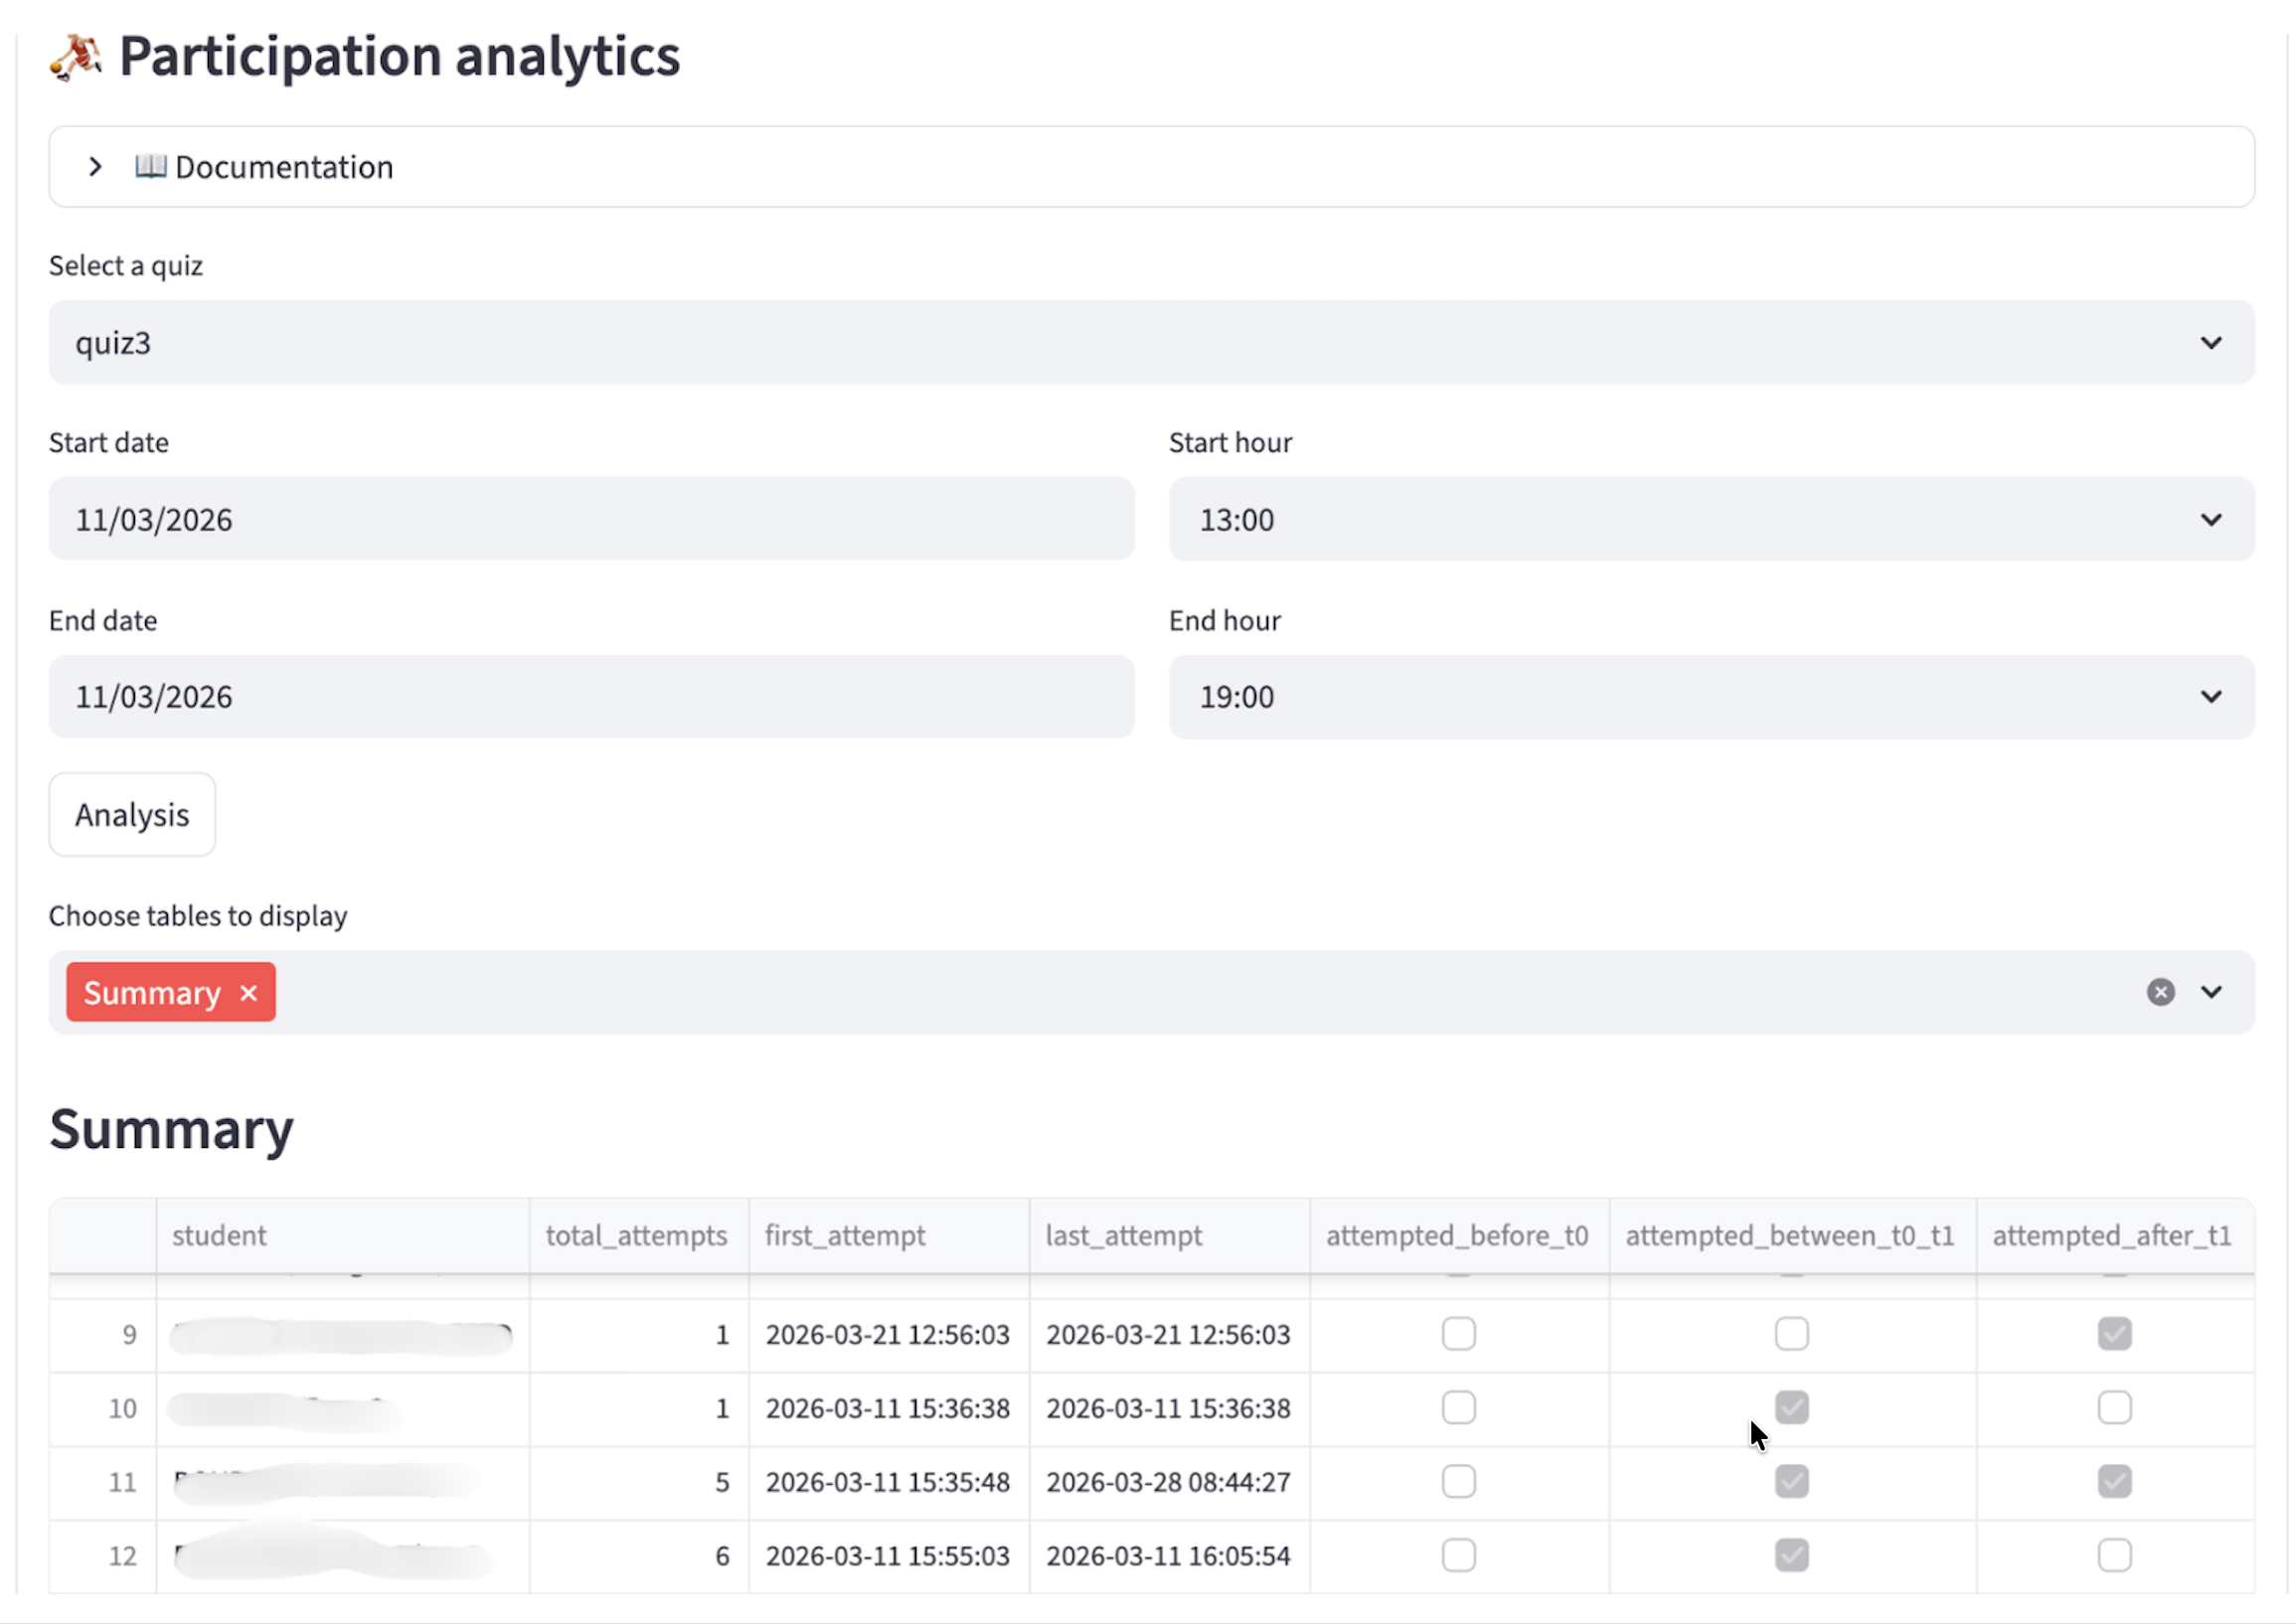
Figure 33:quiz_dash -- Participation analytics: detects and quantify early attempts, late attempts, retakes after the main session, etc.
Since version 1.1, quiz_dash
include a participation analysis sub-dashboard,
has the ability to detects several sessions of work and use them in figures (eg. student timelines).
Since version 0.9.6, quiz_dash
allows to analyze a timeline of responses and scores over time
allows to generate detailed grading reports for all students and download the reports in HTML or PDF format for either individuals or the entire class
Since version 0.9, quiz_dash
allows to take into account different classes or groups of students and display the overall results or results by group,
has been made
persistentwith data saved in the browser’s localStorage, allowing you to resume work in the event of a session (network) interruption, reloading, or closing the browser.